SolarWinds AppOptics Infrastructure, 10 hosts, 100 containers, 1000 custom metrics, 1Yr Service – 41903
Includes
- Auto-instrumented application service topology map
- Pinpoint the root cause of performance issues
- Performance monitoring
- Full-stack visibility
- Modern infrastructure monitoring
- AWS monitoring
For The Immediate delivery contact the sales team. Usually, Ship in 2-3 days, images are for illustration purposes only.
Call for Price
SolarWinds AppOptics Infrastructure, 10 hosts, 100 containers, 1000 custom metrics, 1Yr Service – 41903
- Auto-instrumented application service topology map
- Pinpoint the root cause of performance issues
- Performance monitoring
- Full-stack visibility
- Modern infrastructure monitoring
- AWS monitoring
PN: 41903
SolarWinds AppOptics
SaaS-based simple, powerful, and affordable infrastructure and application monitoring (APM) for custom on-premises, cloud, and hybrid systems.
Overview
Infrastructure monitoring is an IT-managed business process. The primary goal is to manage equipment, policies, processes, and other resources that impact an organization’s IT assets, thereby minimizing asset downtime and improving efficiency. This involves collecting and analyzing data from each asset.
SolarWinds provides several options that allow you to monitor your infrastructure. You can implement these options together or separately. For example, the SolarWinds Snap Agent for Linux and Windows gathers system metrics, supports a variety of infrastructure monitoring integrations, and supports log monitoring by integrating with Loggly or Papertrail. Additionally, AppOptics can gather infrastructure metrics directly from AWS CloudWatch, Azure, and Heroku. To get in-depth insight into custom applications, see APM and Distributed Tracing.
Your business runs on applications, and when they go down or run slowly, it can impact the business in lost productivity, customers, or revenue. To add to the complexity, your IT environment is changing, and workloads can be spread across data centers and cloud resources. You need to monitor the availability and performance of applications and infrastructure, regardless of where they are, so you can identify potential issues early and address them before they impact users.
Key Features
- Auto-instrumented application service topology map
- Pinpoint the root cause of performance issues
- Performance monitoring
- Full-stack visibility
- Modern infrastructure monitoring
- AWS monitoring
Features
AppOptics speeds root cause analysis of application performance issues across AWS, Azure, and hybrid environments.
Unprecedented Visibility
Complete visibility into the health and performance of your applications and their supporting infrastructure.
Performing as Designed
Create performance metrics to automate monitoring of business-critical services and applications.
Quick Problem Identification, Fast Resolution
Minimize downtime with early warning notifications. If systems fail, help ensure you can recover quickly.
Cost-effectively Scale with Your Business
Support the ebbs and flows of your business. Use a cloud-scale APM tool designed for today’s dynamic IT environment.
Auto-instrumented application service topology map
Provide users with a view showing the relationships between services and their dependencies
The service map is meant to provide context for how a service or dependency translates to end-user performance. With the application service map, you can move into a particular service to view more detailed performance metrics (root cause of service degradation, transaction traces, exceptions, performance over time, etc.).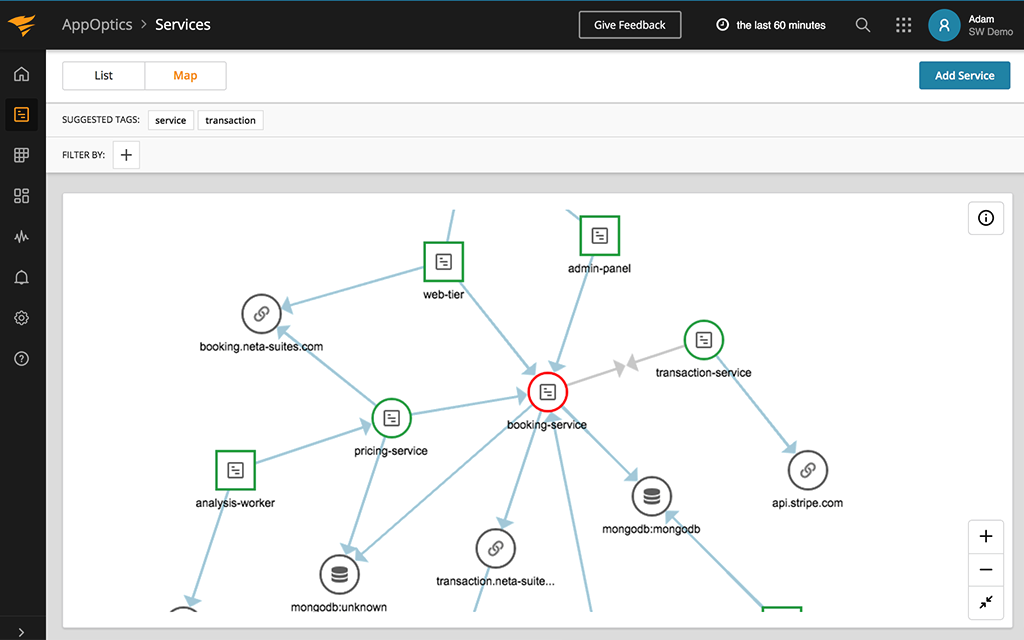
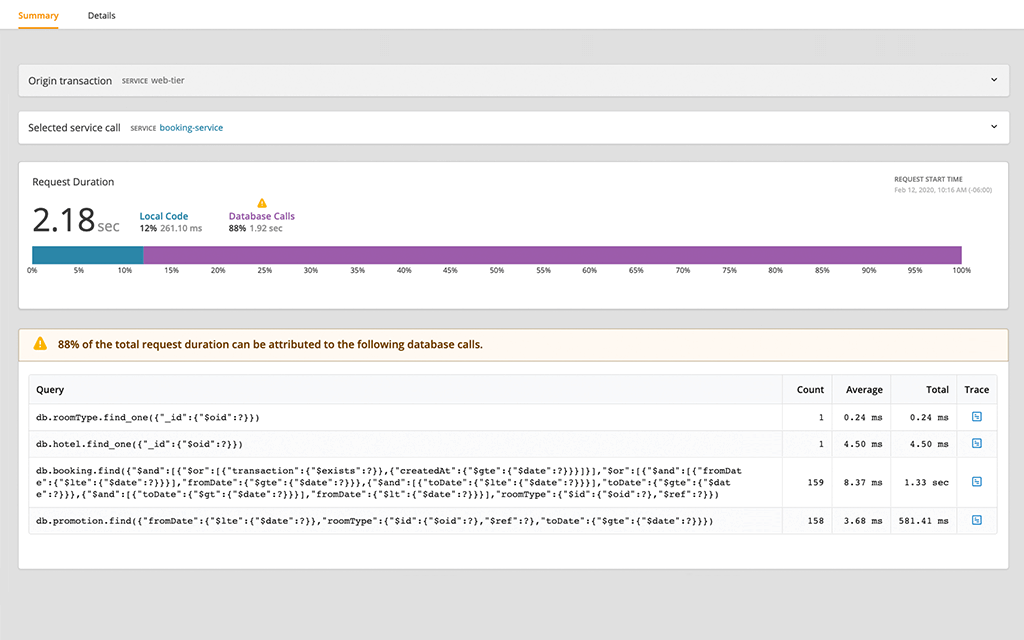
Pinpoint the root cause of performance issues
Find slow queries, bugs, inefficient code, or problems with the infrastructure.
AppOptics trace- and service-level root cause simplify pinpointing application performance issues. These simplified views work for legacy monolithic applications just as well as they work for modern apps running in Kubernetes. Remove the guesswork from your incident response and have your teams focus on working together to solve the problem.
Performance monitoring
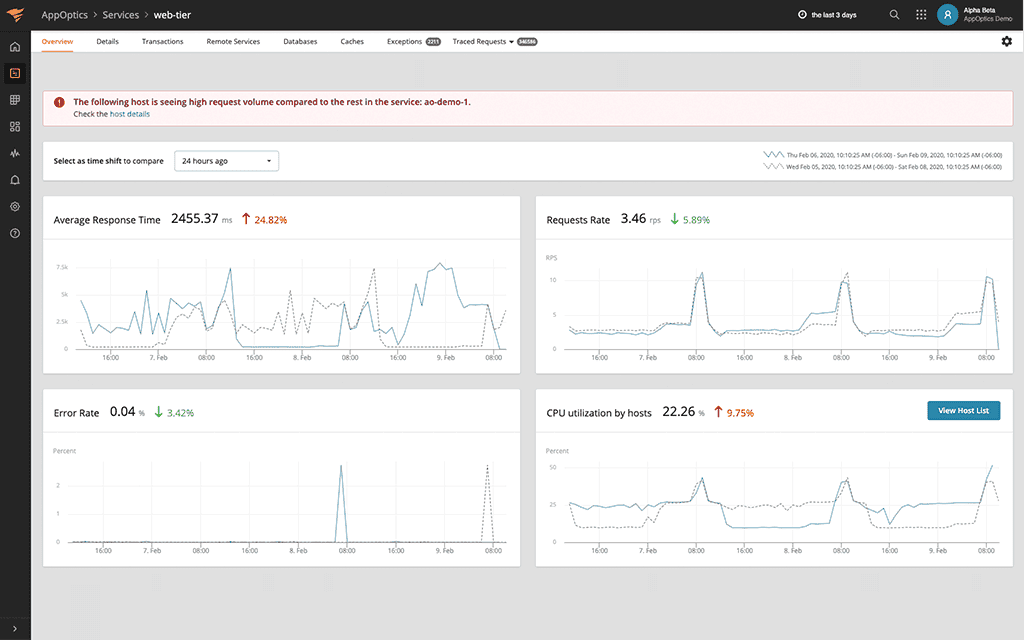
Comprehensive performance monitoring, from custom on-premises to your highly distributed cloud applications, in one product.
AppOptics performance monitoring goes deep and wide, including applications, transactions, services, servers, hosts, containers, and serverless. It’s powerful made simple with auto-instrumentation, a one-click connection from hosts and transactions to their associated logs, and simplified root cause summaries, making APM valuable in just about anyone’s hands.
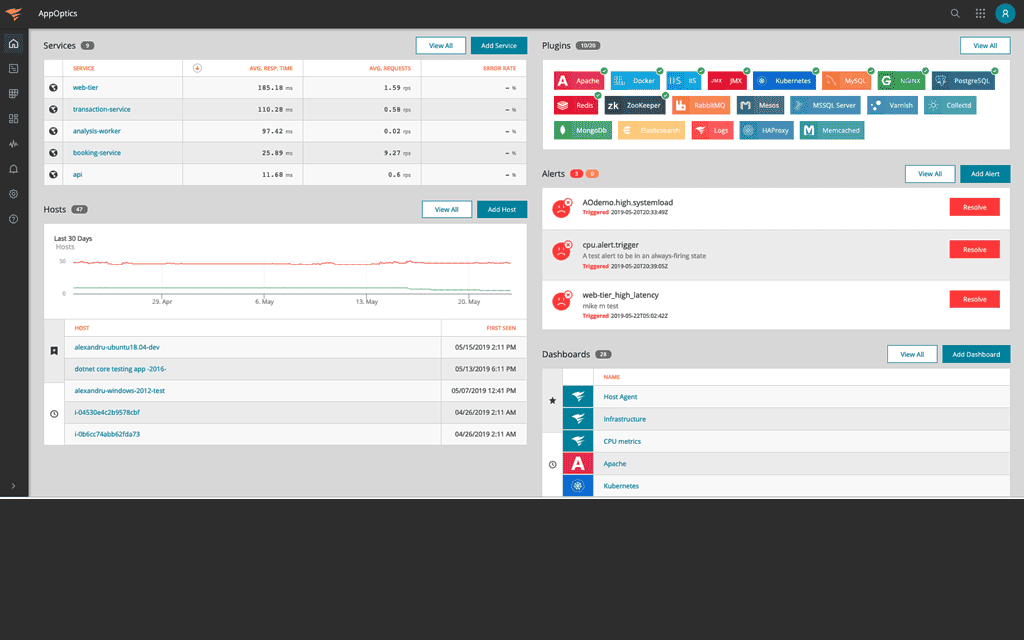
Full-stack visibility
Remove the wall between Application and Infrastructure metrics, allowing combined dashboards.
Get a bird’s-eye view across all your servers, hosts, containers, and serverless environments. Cross-reference application and infrastructure metrics side by side in the same dashboard.
Modern infrastructure monitoring
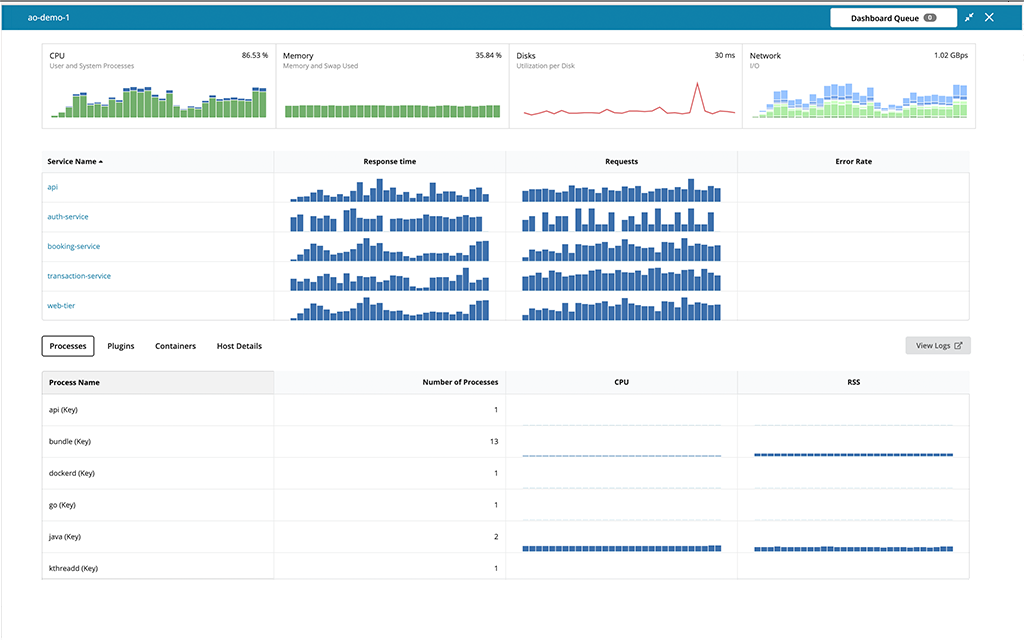
Consolidated monitoring of all your servers, hosts, containers, and serverless environments.
Infrastructure monitoring for your legacy and new IT implementations with simple-to-click drilldowns into resource utilization and performance by services, containers, and processes.
AWS monitoring
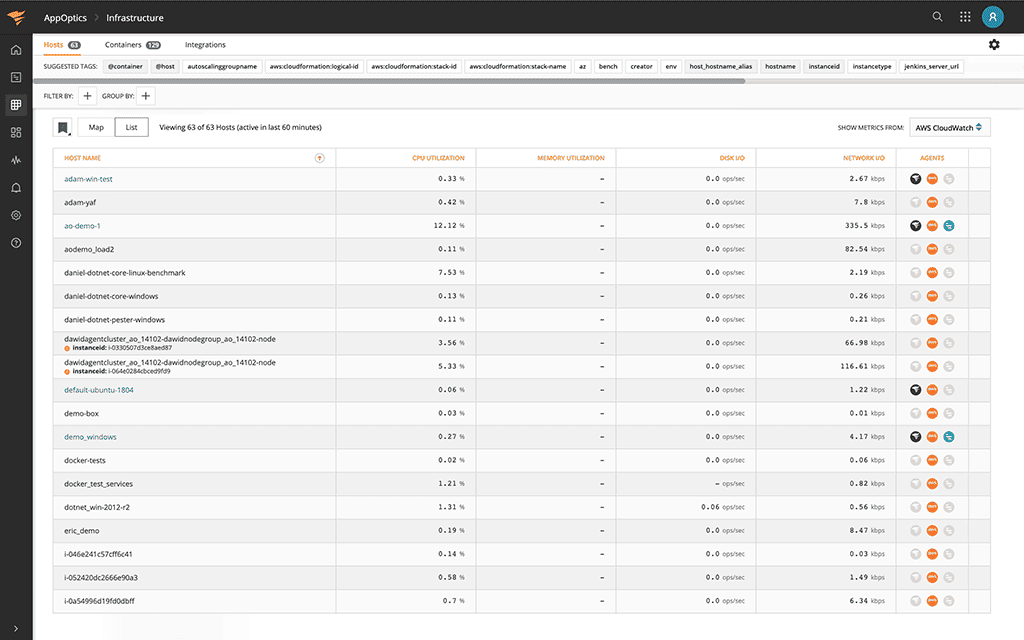
SaaS-based monitoring of your AWS services and custom applications.
Monitor over 30 AWS services with broad application language support (.Net, Java, PHP, Python, Scala, Node.js, Go, and Ruby).
Azure monitoring
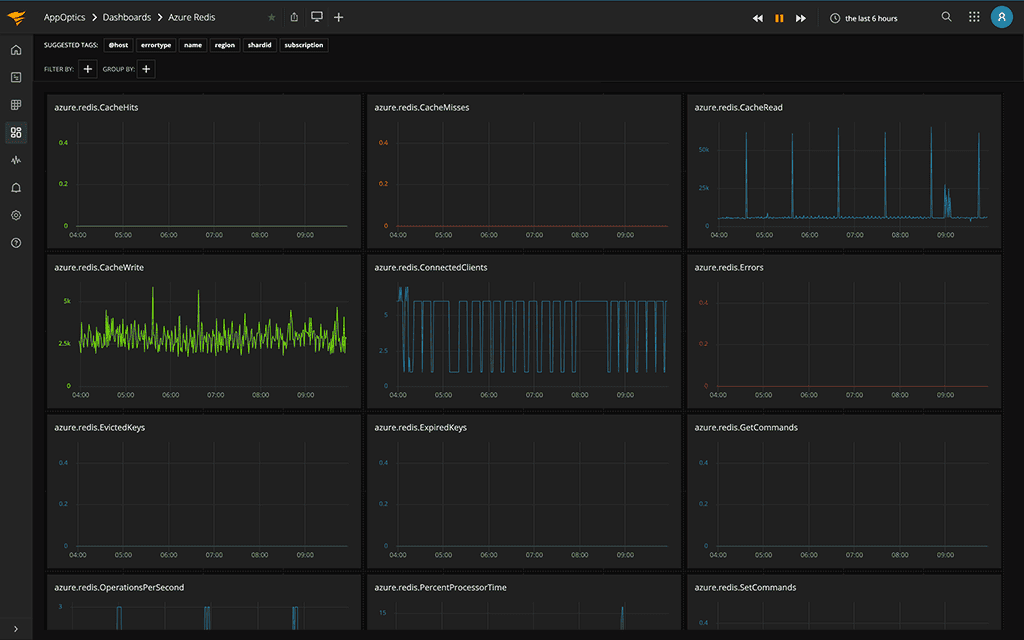
SaaS-based monitoring of your Azure services and custom applications.
Monitor Azure services including Load Balancer, Cosmos DB, SQL Database, Redis, and Azure App Services with broad application language support (Java, PHP, Python, Scala, Node.js, Go, and Ruby).
Identify hotspots early
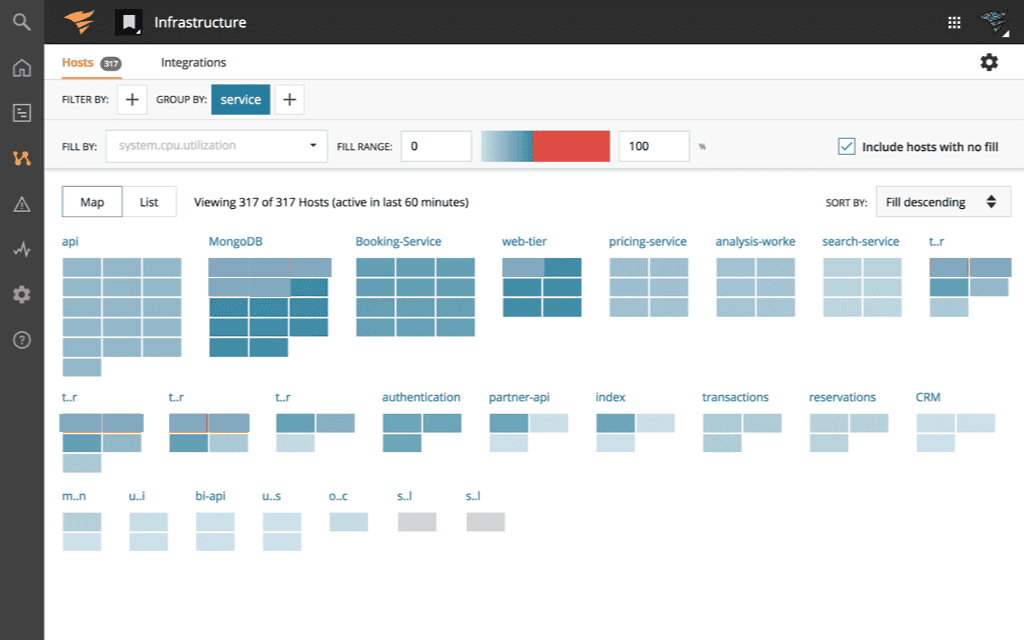
Quickly identify which hosts have exceeded thresholds and could be impacting application availability and performance.
Avoid downtime with color-coded heatmaps that provide visualizations of all your hosts, and containers with comprehensive alerting on key performance metrics across the stack.
150+ Plugins and Integrations
With over 150 out-of-the-box plugins, integrations, and custom metrics, you have everything you need to monitor your critical systems.
Measure what matters with AppOptics. It’s an APM tool offering the ability to perform full-stack monitoring of your systems, including key business metrics associated with those applications.
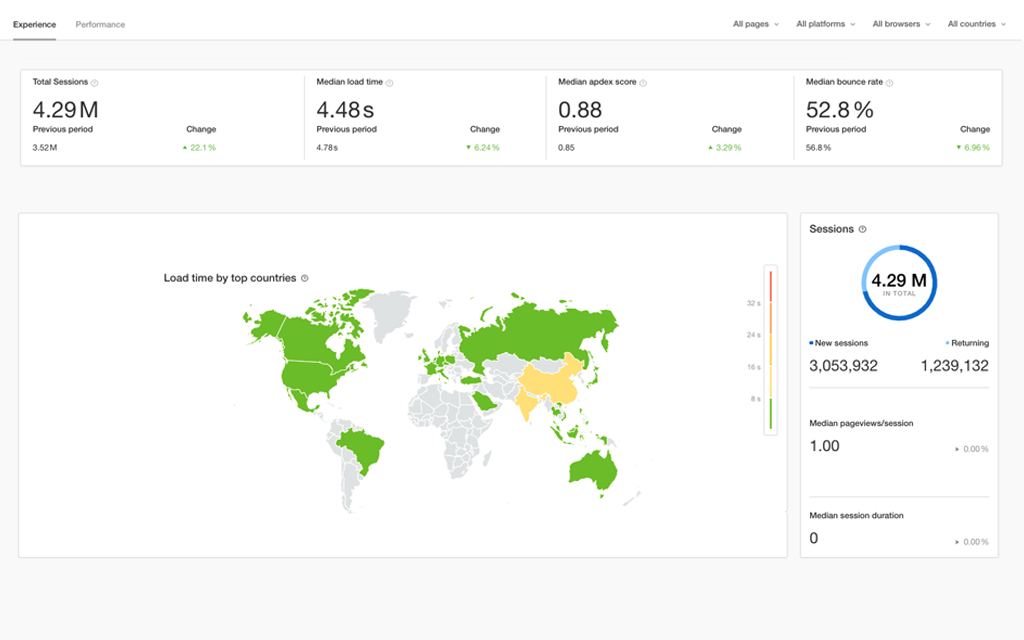
Digital Experience Monitoring
Make your websites more reliable with client-side performance monitoring integrated with your APM.
Achieve complete observability and accelerate troubleshooting by integrating synthetic monitoring and real-user monitoring powered by SolarWinds® Pingdom®.
Log Management and Analytics
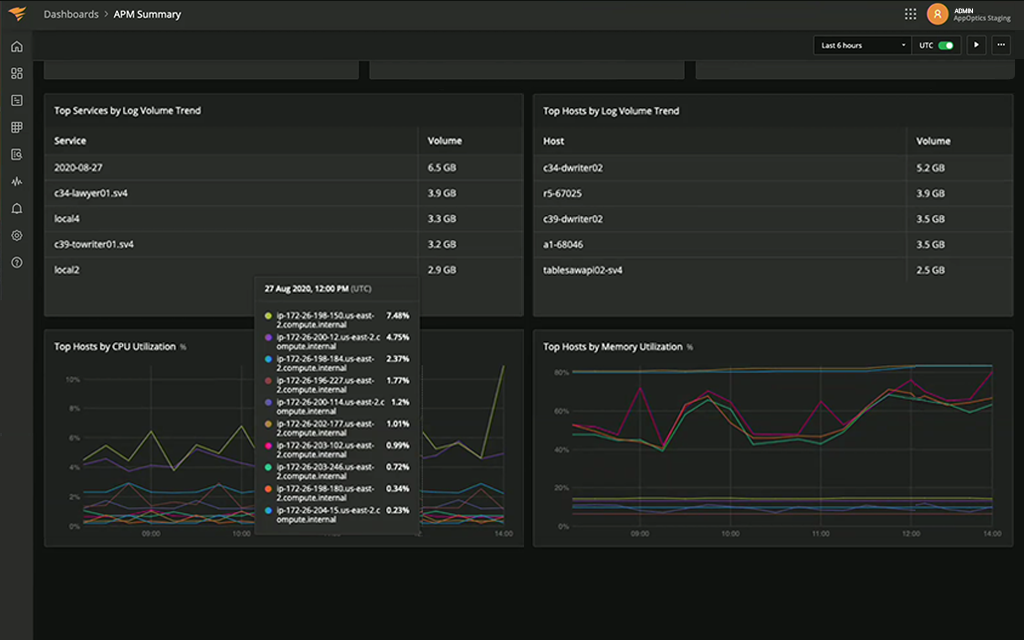
Collect, search, and analyze the log data of your applications and supporting infrastructure to quickly pinpoint problems.
Achieve complete observability by integrating your metric, trace, and log data into a single integrated APM experience. Accelerate troubleshooting and identification of the root cause of performance issues.
Identify and alert
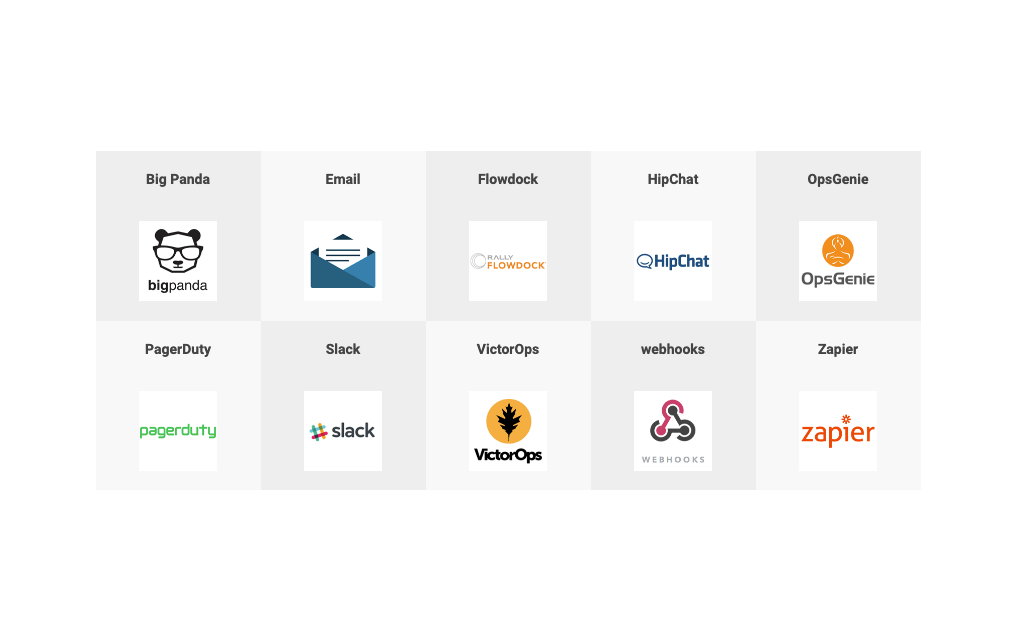
Be the first to know when there’s an availability or performance issue.
Single pane of glass visualization of thresholds that have been exceeded, paired with comprehensive alerting through major notification services like Slack, PagerDuty, Opsgenie, email, webhooks, and more.
Reduce MTTR
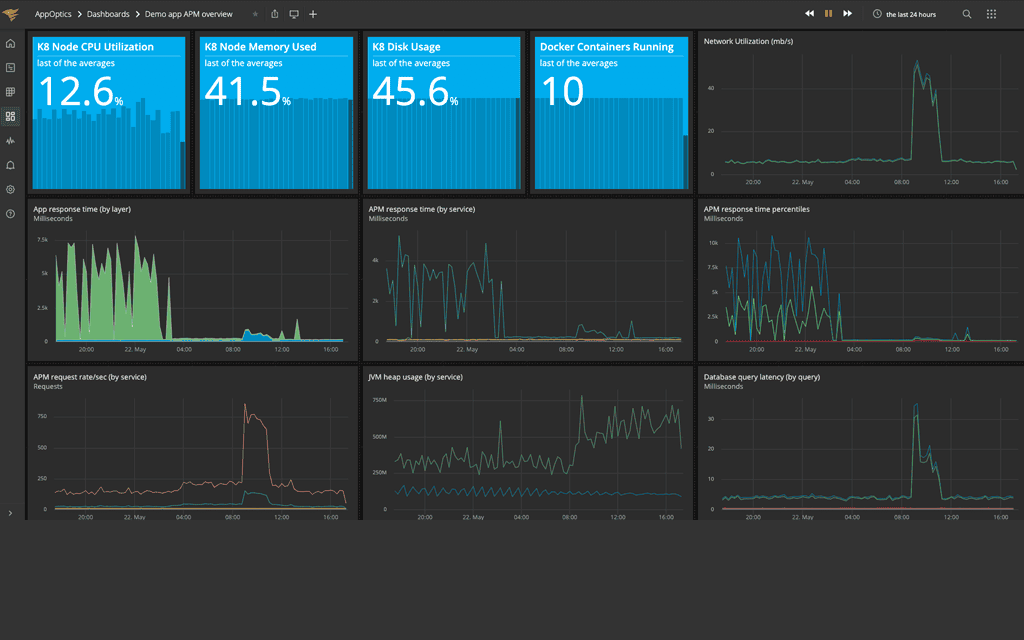
AppOptics is a converged APM tool bringing application and infrastructure monitoring together on common dashboards.
Monitoring infrastructure and application metrics side by side, reduces the time it takes to identify what part of the stack is failing, so you can quickly get to root cause.
Accelerate troubleshooting
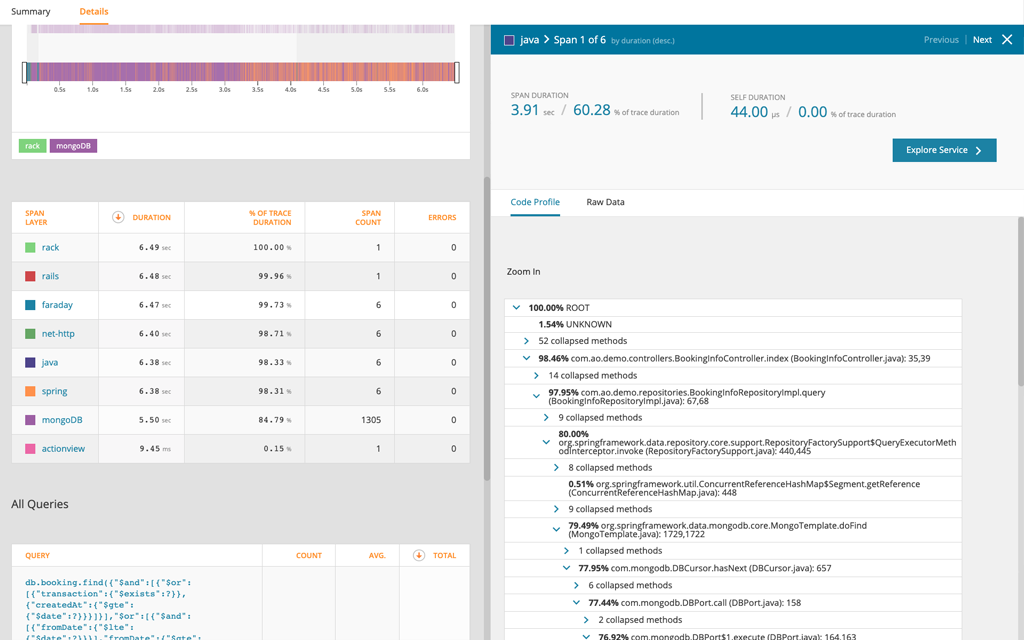
Thread the needle on application performance issues by identifying the functioning code causing the problem.
Code profiling combined with distributed trace enables you to go beyond the poor-performing service and identify the line of code causing the poor performance.
Align performance goals with business goals
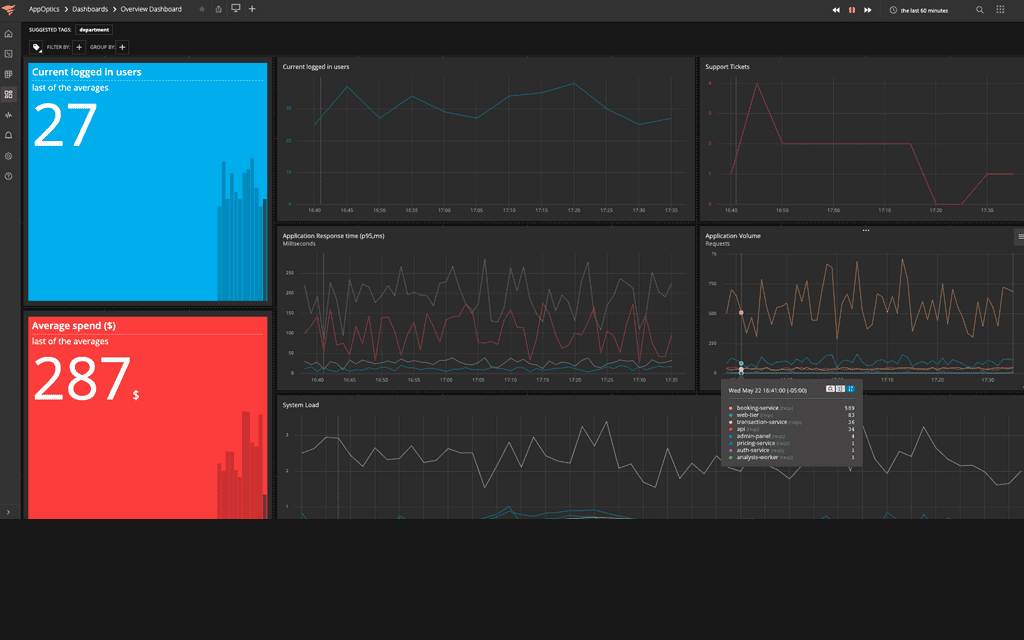
Use AppOptics to measure application and business performance and their impact on your business
Incorporate custom metrics to combine business metrics side by side with system metrics. See and measure the impact infrastructure and application performance has on your business performance.
Optimize for speed, efficiency, and cost
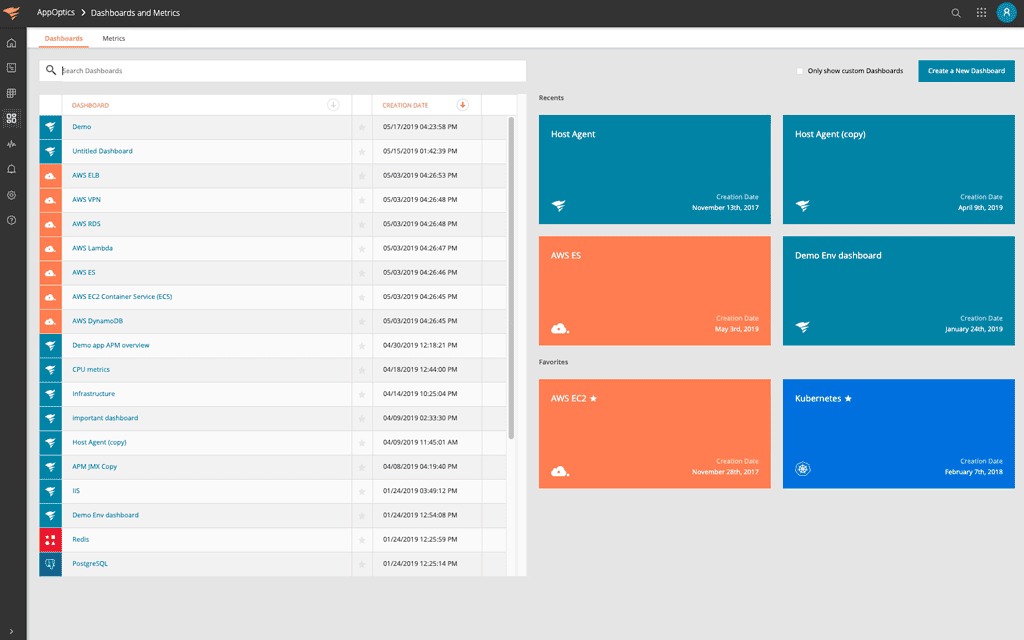
Correlate resource allocation to application performance, so you use what you need—no more, no less.
Leverage out-of-the-box dashboards and analytics to maximize performance while ensuring you don’t overspend or under-utilize precious on-premises and cloud resources.
Published on lastbestprice.com
Datasheet




















Reviews
There are no reviews yet.