SolarWinds Database Performance Monitor Per Premium Production Instance (2500+ licenses) – 42049 – 1Yr Service
- SaaS platform with a web-based user interface
- Lightweight agents via multiple configurations
- Monitors databases in the cloud, locally, or hybrid
- Real-time and historical data to pinpoint performance issues
- Multiple ways to help protect sensitive data; SOC2 compliant.
PN: 42049

SolarWinds Database Performance Monitor
Database performance monitoring and optimization for traditional, open-source, and cloud-native databases.
Overview
SolarWinds® Database Performance Monitor (DPM) provides deep database performance monitoring at scale, without overhead. Our SaaS-based platform helps increase system performance, team efficiency, and infrastructure cost savings by offering full visibility into major open-source databases including MySQL® , PostgreSQL® , MongoDB® , Azure® SQL, Amazon Aurora® , and Redis® .
Features
- 24/7 monitoring, for both real-time and historical analysis
- One-second granularity helps you spot and diagnose small performance issues
- Compare queries, databases, and more with custom side-by-side views
- Comprehensive database performance analytics include query samples and explain plans
- Weekly and daily summary reports and customizable alerts
- Unified view of all your database types and servers to understand your system
- Meaningful summaries show you golden signals of service quality and health for database and system performance
Database Support
- MySQL
- PostgreSQL
- MongoDB
- Amazon Aurora
- Redis
- Microsoft SQL Azure
Key Benefits
- Visualize thousands of collected metrics across thousands of databases with simple-to-create and -share charts
- Cross-functional team workflow is facilitated with notebooks to create and share knowledge
- Optimize resources and reduce database incidents with one-second resolution into workloads
- Ship better code
- See query response before and after a deployment event
- Examine query details and performance including samples and execution plans
- Compare the performance of your top queries over time
- Troubleshoot and diagnose outages
- Correlate query response or behavior to system metrics to understand impacts
- Isolate unusual behavior and potential contributing factors within the database
- Understand database health
- Track metrics and watch for trends with health summary for databases and systems
- Get recommendations based on best practices
- Explore and examine performance outliers
Details
- Support for physical, virtual, and cloud-based databases, including AWS® RDS
- Architecture
- Secure, cloud-hosted platform
- In-flight and at-rest encryption
- Role-based access control, single sign-on, and SAML integration
- Configurable option to filter customer sensitive data
- Built on the International ISO/IEC 27000 family of standards
- GDPR compliant along with SOC 2 Type II certification
- Alerting and integration module allows for injection warnings to be transmitted directly to email, Slack® , VictorOps® , or any number of messaging systems
Database Performance Monitoring shouldn’t be hard.
Do you find yourself asking…
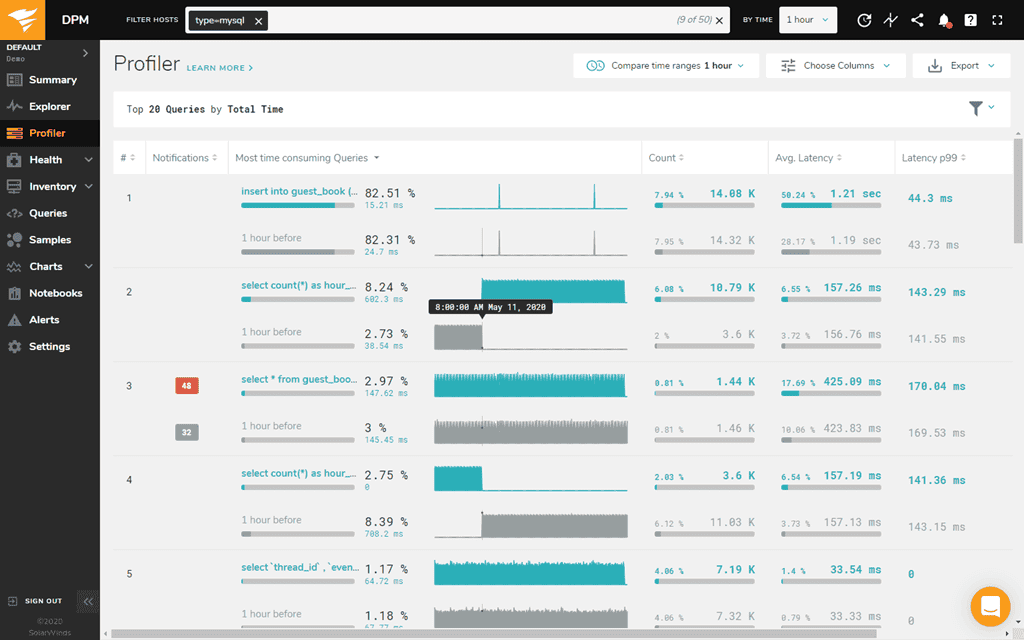
Is there a way to compare data before and after to see if performance was affected?
With SolarWinds® Database Performance Monitor (DPM), the Profiler feature can help you deploy code with confidence by comparing time ranges. Custom timeframes allow you to see if and how query response changed after a new release.

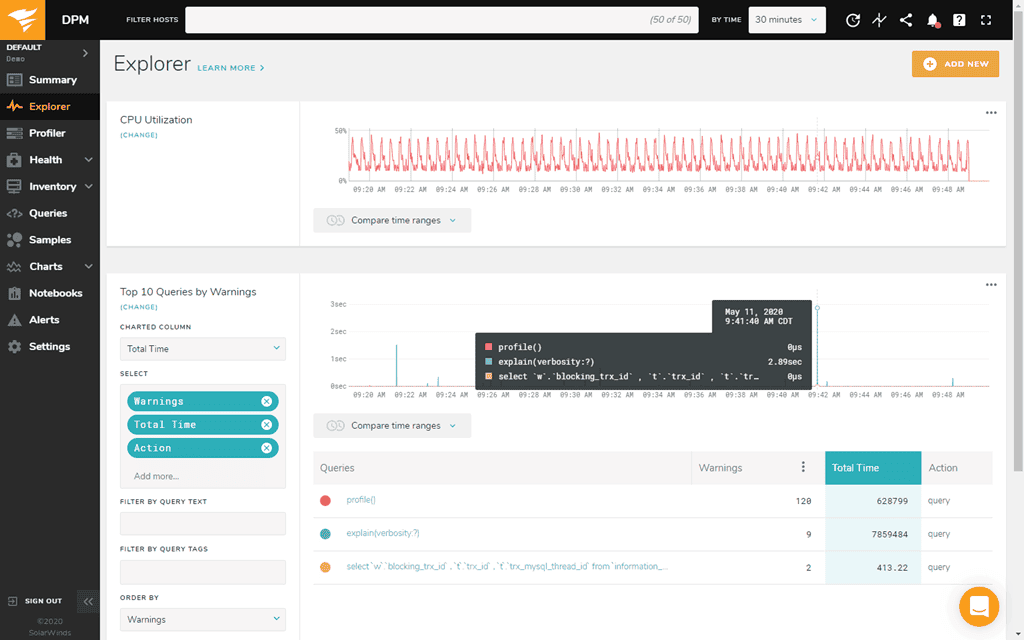
Can I quickly find the query or queries with the most impact on CPU usage?
SolarWinds Database Performance Monitor’s Explorer feature makes it easy to see your queries, their performance, and their impact on the database and infrastructure. View CPU utilization alongside query data, so you can quickly determine if queries are running more frequently, taking longer, or perhaps not using an index when they should.
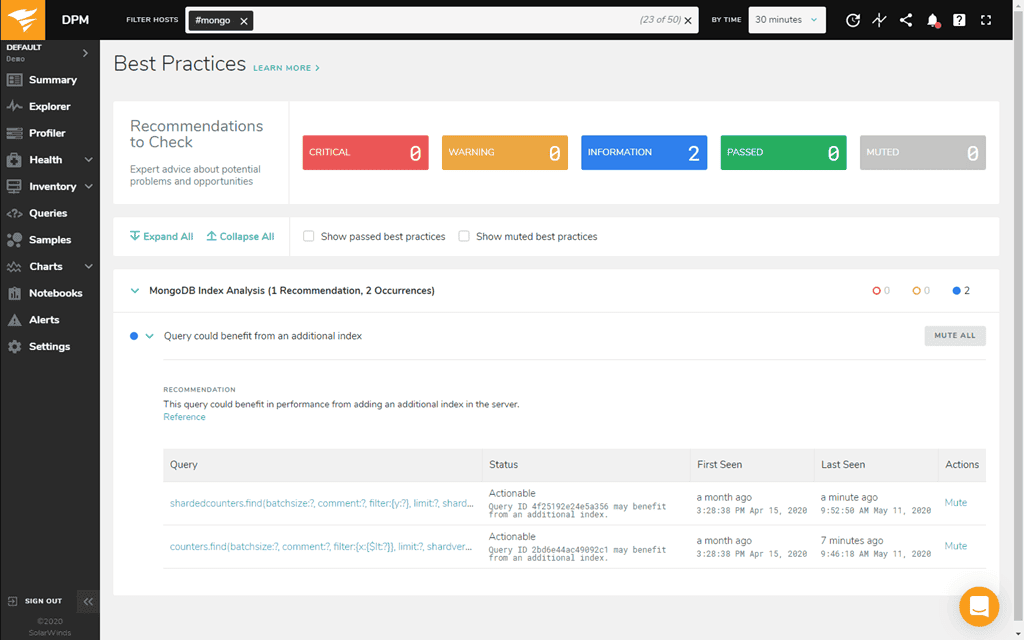
Is it possible to proactively optimize my database?
SolarWinds Database Performance Monitor gives you a visual view of overall database health and provides recommendations to make your database run even better.
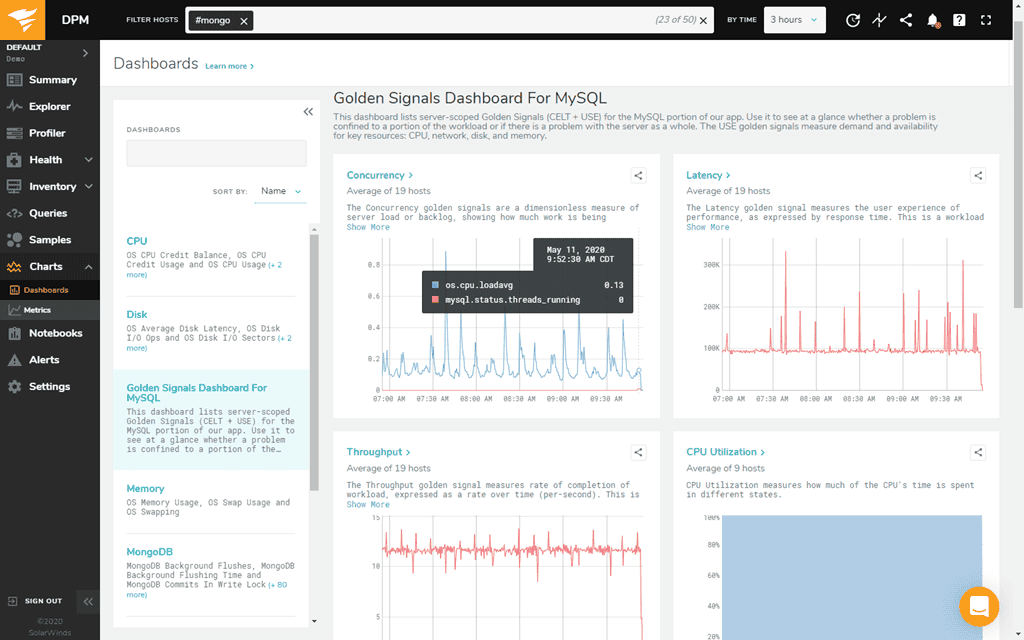
How can I create a custom view for a database focusing only on the metrics I care about?
The Dashboards interface in SolarWinds Database Performance Monitor makes it easy to visualize the thousands of metrics collected about your queries, database, and infrastructure. Dashboards are simple to create and share.
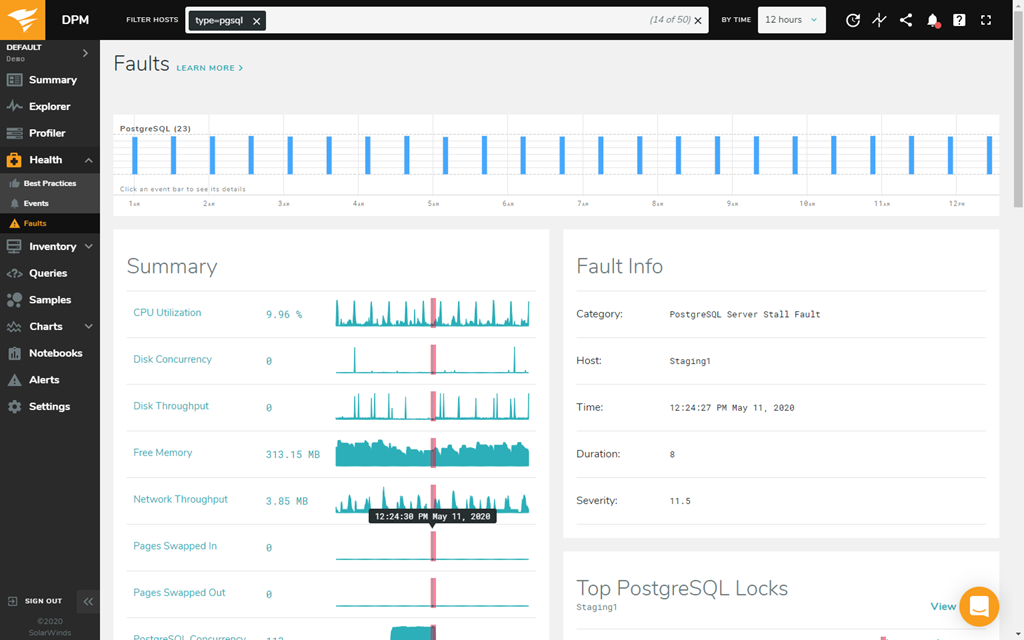
Traditional threshold monitoring can miss small interruptions to server or service availability. Is there a way to find them?
Adaptive fault detection in DPM helps find small interruptions to server or service availability. Finding faults while they’re small can avoid serious outages later.
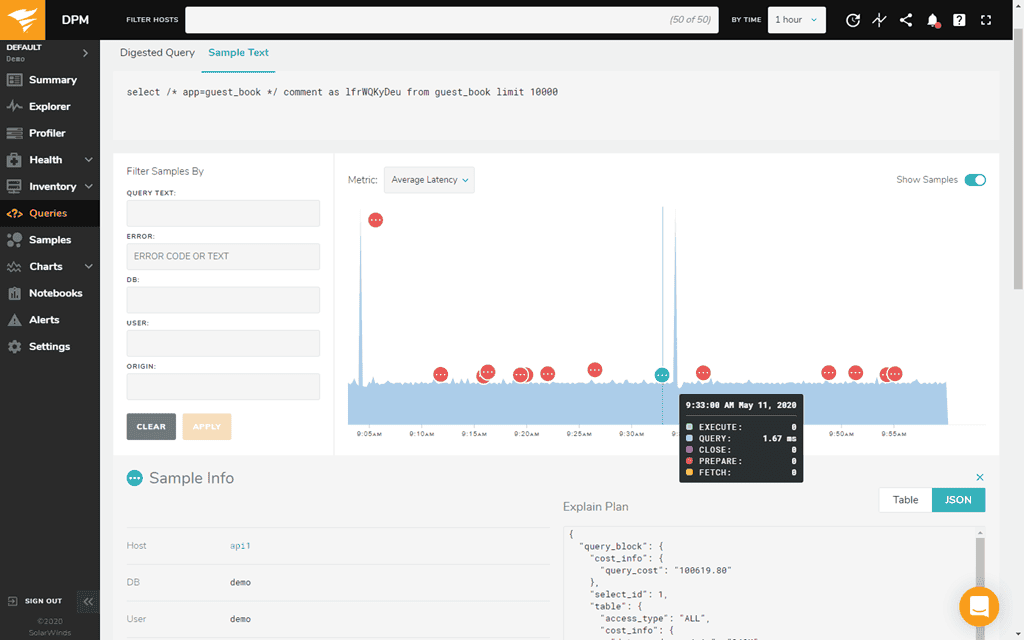
How can I find both typical performance and performance deviations for a specific query or queries?
With DPM, you can filter by query text, host, and timeframe to get a detailed view of a specific query or queries. You can also filter by errors, missing indexes, slow response time, and more to find your worst performing queries.
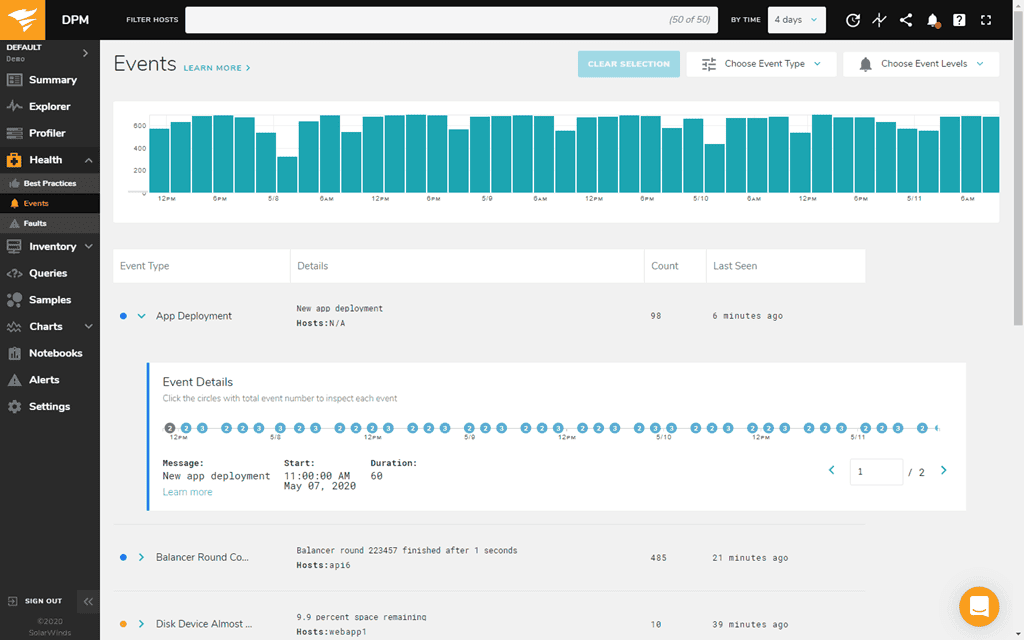
Can I be warned of problems before they impact database performance or availability?
The combination of events and alerts in DPM ensure you’re aware of any detected or inferred abnormalities to the system, host, queries, and more.
Datasheet


Reviews
There are no reviews yet.