SolarWinds Digital Experience Observability – Real User 100,000 Page Views per month – 103807 – Annual Subscription

SolarWinds Digital Experience Observability
Metrics and insights that connect user experience to application performance and business outcomes.
Overview
Digital Experience Observability
An exceptional user experience, every time
Put your user first with user experience monitoring, metrics, and visualizations to identify emerging issues before your users do.
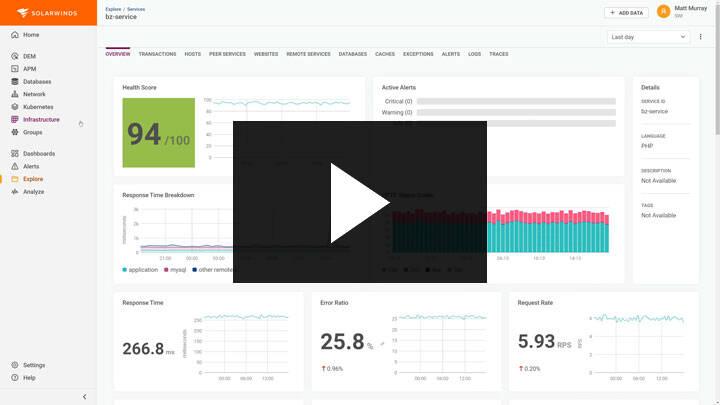
Website performance at a glance
A single view with AIOps/machine learning-powered health score, uptime status, site metrics, response time, and active alerts by website and URL.
Real-user monitoring in real time
Deep user-based analysis, including where users are located, which browser and operating system are used, load times, page views, most visited pages, and more.
Global monitoring, with a local focus
Global availability and response time monitoring by region, country, and city to identify performance variations and optimize user experience across all geographies.
Connect web metrics to business outcomes
Plugs into SolarWinds Observability Platform to contextualize performance data across the digital delivery chain and link website performance to business outcomes.
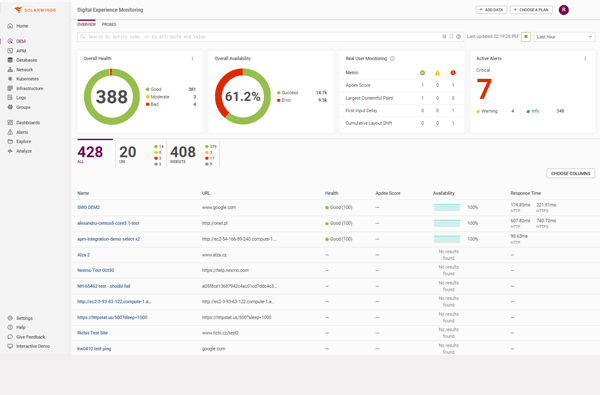
Digital Experience Monitoring
Optimize User Journey
Experience site performance the way users do to optimize the user journey
- Web application health score based on golden metrics and ml-based anomalies.
- Interactive performance charts, website details, and APDEX user satisfaction score.
- Availability and response time monitoring by region, country, and city.
Real User Monitoring
Discover who your users are with real user monitoring to tailor performance
- Where users are located, the device, and the browser they used
- The amount of time the site took to load, broken down by front end, backend, networks, and processing.
- How much time was spent on network, frontend, and backend processes.
Troubleshoot Web Apps
Quickly identify and troubleshoot issues with a user impact to reduce MTTR
- Use filters to drill down into the performance metrics to identify bottlenecks.
- Identify anomalies with built-in intelligence.
- Measure the user impact of system changes
- Bring focus to business-impacting issues with smart alerting
Correlate with APM
Connect to SolarWinds Observability platform for unified user and application performance monitoring
- Monitor website, application, infrastructure, database, and network performance in a single pane of glass.
- Embedded context connects user actions through the front and back-end systems
- Explore related hosts and services, and associated traces
Features
SolarWinds Observability is an integrated, full-stack observability solution built to connect data from web applications, their services, cloud, and hybrid infrastructure, including Kubernetes, AWS and Azure, databases, networks, and end-user experience to deliver holistic business insights, operational intelligence, and smart automation. SolarWinds Observability simplifies the complexity of managing and monitoring distributed environments and helps DevOps and IT Ops teams to optimize performance and ensure reliability for business-critical systems.
OBSERVABILITY AS A SERVICE
SolarWinds Observability is designed to collect, connect, and contextualize disparate data types and deliver actionable insights to solve complex business problems. SolarWinds Observability offers users:
- Holistic visibility, health, and performance status across a diverse technology landscape, enabling insights into critical business applications and all their underlying components, significantly reducing complexity.
- Logical entity groupings so you can establish responsibility areas for and manage entity relationships, and collaborate through entity management. These help provide contextual relevance to a collection of entities in the SolarWinds Platform.
- Observability for modern, custom, cloud-native, and hybrid web applications provides actionable intelligence powered by AIOps and ML.
- Expedited problem identification and resolution so you can proactively manage complex and distributed environments with a highly correlated single source of truth.
- Unified data from logs, metrics, traces, database queries, and the user’s experience built to deliver intelligent insights and increase productivity.
- AIOps enhanced with machine learning helps you move from reactive to proactive by prioritizing real problems, filtering the noise, reducing complexity, and increasing focus on urgent issues with real-time insights into the health and performance of applications and services—regardless of how distributed they are or where they run.
- Simplified management of complex modern applications so you can focus on innovation and feature delivery.
- Easy compatibility with native, open-source (OpenTelemetry) standards-based frameworks and a data connector and APIs with third-party integration frameworks.
- Built-in ecosystem support to enable partners and integrators to deliver customized solutions.
SOLARWINDS OBSERVABILITY – UNMATCHED OUTCOMES
Quick time to value
Streamlined onboarding helps you get up and running with SolarWinds Observability in minutes.
Lightning-fast troubleshooting to help reduce MTTR
No need to dig through multiple tools and screens. SolarWinds Observability provides all the insights for related services together in topology maps and groupings, making it easy to quickly and visually identify the key elements impacting availability and performance.
Information at a glance
New health score is based on golden metrics and anomalies detected to quickly highlight issues.
Customizable views
New entity groups allow data from multiple sources to be monitored and tracked together to tailor the platform to any environment.
Maximum coverage with minimal upkeep
Unified agent management and automated agent updates, along with support for OpenTelemetry (OTEL) and agentless monitoring, can eliminate most maintenance.
Work smarter
Shared alert creation and management to reduce repetition. Color-coded alert list helps you focus on what matters and reduce alert fatigue. Unified alert notification supports email, Microsoft® Teams ® , Slack ® , OpsGenie ® , PagerDuty ® , Zapier® , and Webhook. Service management integrations with SolarWinds ® Service Desk and ServiceNow® .
Right-sized data views
Unified, out-of-the-box, and customizable dashboards and charts designed to provide a holistic view with the ability to drill down into the underlying data.
Collaborate easily
A single user interface provides a shared view of the environment, helps eliminate communication challenges, and enables different teams to work together efficiently.
Integrates with IT Service management
SolarWinds Service Desk and ServiceNow
ADVANTAGES
- A single, full-stack, unified SaaS platform
- Simple, one-click correlation in context metrics, traces, logs, databases, websites, etc.
- Comprehensive visibility
- Deployment flexibility
- AI/ML built-in intelligence
- Adaptive scalability
- Multiple monitoring entities, including websites, services, hosts, logs, AWS, Azure, databases, and private networking devices
- Logical entity groupings for holistic health monitoring at any level based on technology, location, or key business services, to name a few
DIGITAL TRANSFORMATION JOURNEY:
Observe Everything from Anywhere
SolarWinds Observability offers a cloud enabled single view of data no matter where customers are in their digital transformation journey and helps them accelerate their transformation.
SolarWinds Observability integrates with SolarWinds Hybrid Cloud Observability so you can leverage data from cloud-native, multicloud, hybrid, and on-premises sources for truly comprehensive observability across the entire environment and superior deployment flexibility.
Secure By Design
SolarWinds’ leading the way for safer information technology. We Believes that security should be at the core of his competence of all organizations and are committed How to set a new standard for software Developing on the basis of rigorous adherence to this Our comprehensive security framework, which consists of a combination of layers. From the SDLC to the infrastructure and the people.
UNIFIED CAPABILITIES OF SOLARWINDS OBSERVABILITY INCLUDE
Application
Comprehensive and detailed code-level monitoring to assess, debug, and troubleshoot application performance with time series metrics and distributed tracing. Ensures the availability and performance of applications and services, specializing in cloud-native, custom, distributed microservices-based applications.
- Delivers data-rich intelligence on the state of critical business services deployed across multiple cloud-native technologies and providers
- Reduces MTTR to help increase productivity of high-velocity DevOps teams
Infrastructure
Ensures the health and performance of cloud-based and on- premises resources, including virtual and physical hosts, and Kubernetes ® orchestrated containers across multiple cloud service providers.
- Offers data-driven insights allowing AIOps to proactively monitor health and performance across cloud resources
- Scales seamlessly with broad support for cloud-native and open frameworks and comprehensive support for third-party integrations to better simplify operations
Logs
Scalable, full-stack, multi-source log management combining broad support, powerful search, log filtering, and built-in integration with application and infrastructure observability (licensed independently), delivering context-rich intelligence enabling teams to troubleshoot smarter and faster, increasing productivity.
- Provides context to event data with analysis of log data across the entire set of cloud applications, services, and infrastructure stack reduces complexity
- Simplifies troubleshooting with real-time log tailing and intuitive search across all logs to accelerate root cause
- Leverages cloud-native frameworks for easy setup with comprehensive support for cloud-native and open-source
Digital experience
An integral part of the unified SolarWinds Observability solution, it provides the client-side or end-user perspective of availability and performance of web applications.
- Includes proactive performance management via automated performance monitoring and alerting for when web applications are running slowly, potentially causing a poor user experience, and catching it before it impacts customers
- Enables global insights into user experience by utilizing probes that can be implemented worldwide to provide insights into users’ perspectives on availability and performance
Database
Provides performance insights to diagnose and analyze issues using sophisticated root cause analysis. Multi-vendor environment support for databases such as MySQL ® , PostgreSQL ® , Microsoft ® SQL Server® , AWS Aurora ® (PostgreSQL, MySQL), AWS RDS ® (PostgreSQL, MySQL), MongoDB ® , MongoDB Atlas, and Redis ® .
- Encourages better code shipment by showing query responses before and after a deployment event
- Speeds up outage troubleshooting and diagnosing with correlated query response or behavior to system metrics and isolate unusual behavior and potential contributing factors within the database to understand impacts
- Creates a complete view of database health with the ability to track metrics, explore and examine performance outliers, and watch for trends with health summaries and recomendations based on best practices for databases
Network
Helps create end-to-end visibility across multi-vendor, on-premises, and multi-cloud networks, combined with AIOps with enhanced machine learning powered analysis of network metrics for insights into the impact of network performance on services and users.
- Gain full visibility into network status and utilization with network device detail views by IP address, machine type, vendor response time, CPU utilization, memory utilization, availability, packet loss
- Insights into network performance and capacity with interface speed, in and out percent utilization average, average availability, active alerts, drill down into history—availability, percentage utilization, byte totals, discards, errors
- Analyze and optimize network traffic with network flows by showing the top 10 endpoints by ingress and egress bytes


Reviews
There are no reviews yet.