


Shop by Category


Special Promotion


Special Promotion


Special Promotion


For The Immediate delivery contact the sales team. Usually, Ship in 2-3 days, images are for illustration purposes only.
Call for Price
PN: 100003
Ultimate end-to-end visibility for your network.
SolarWinds® Network Performance Monitor (NPM) is a powerful and affordable network monitoring software enabling you to quickly detect, diagnose, and resolve network performance problems and outages.
NPM gives organizations the ability to troubleshoot VPN issues with a clear picture of both sides of their VPNs for improved connectivity.
Scale to up to one million elements per instance (with appropriate licenses).
Enable SD-WAN Orchestrator dashboards and edge device monitoring. See release notes for latest supported devices.
Quickly detect, diagnose, and resolve network performance issues and avoid downtime with network optimization software.
View performance, traffic, and configuration details of devices and applications that are on-prem, in the cloud, or across hybrid environments.
Accelerate identification of root cause by dragging and dropping network performance metrics on a common timeline for immediate visual correlation across all your network data.
Respond to multiple condition checks, correlated events, network topology, and device dependencies.
Automatically discover and map devices, performance metrics, link utilization, and wireless coverage.
Automatically calculate exhaustion dates using customizable thresholds based on peak and average usage.
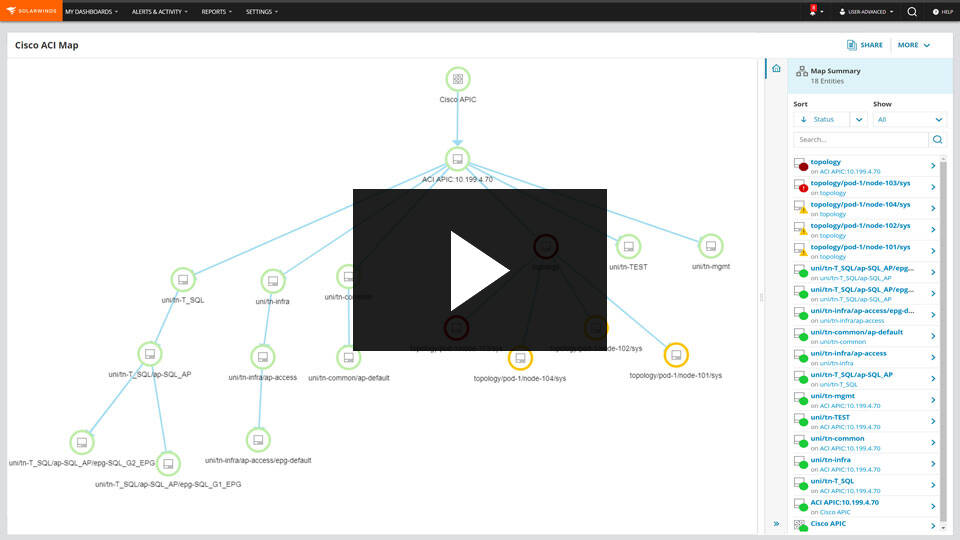
Monitor logical components of the SDN environment, including APICs, tenants, application profiles, endpoint groups, and physical entities with Cisco ACI support.
Intuitive aggregation and visualization of data helps you get to the root cause of issues faster, even in complex environments.
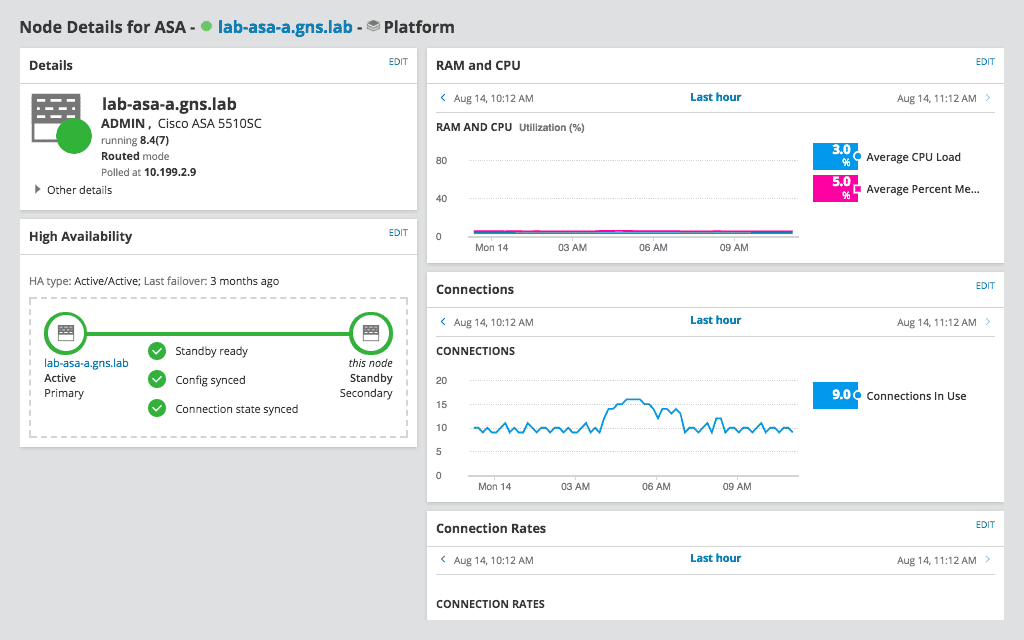
Visualize and gain insight into the health and performance of your F5 ® BIG-IP® load balancers, Cisco ASA and Palo Alto Networks® firewalls, and Cisco Nexus® switches with Network Insight features.
Determine if changes in end-user experience are caused by the application or the network.
Dynamically calculate baseline thresholds from historical network performance data.
Monitor, alert, and report on key device metrics, including temperature, fan speed, and power supply.
Schedule and generate custom network performance reports with one of over 100 out-of-the- box templates.
Enjoy a free, fully functional 30-day trial, consultant- and services-free deployment, and customizable web-based network performance dashboards, views, and charts.
SolarWinds Platform products can be deployed on physical or virtual servers onpremises or in the cloud. These products can also be deployed via the Azure or AWS® marketplaces. For detailed system requirements, visit support.solarwinds.com.
NOTE: The minimum server requirements listed assume default configuration. Significantly increasing the poll rate or statistic collection rate could result in additional load on the server, which may require a larger CPU or additional memory.
If your VPN tunnels are down, users may be unable to access network services that are critical to the business. NPM network monitoring software provides visibility into the health and performance of your entire Cisco ASA environment, so you can easily view the status of VPN tunnels to help ensure connectivity between sites.
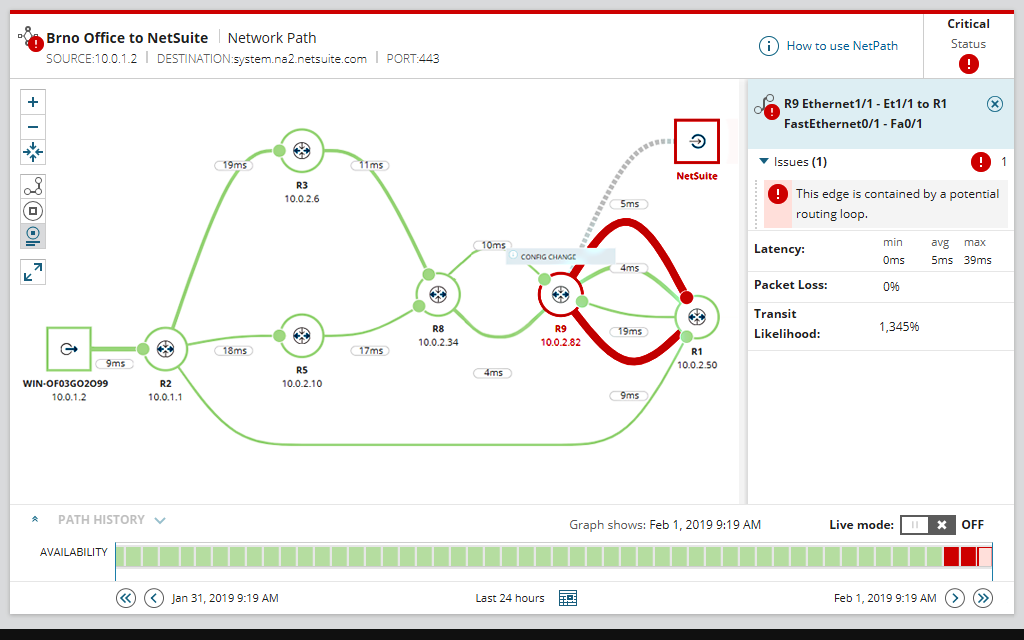
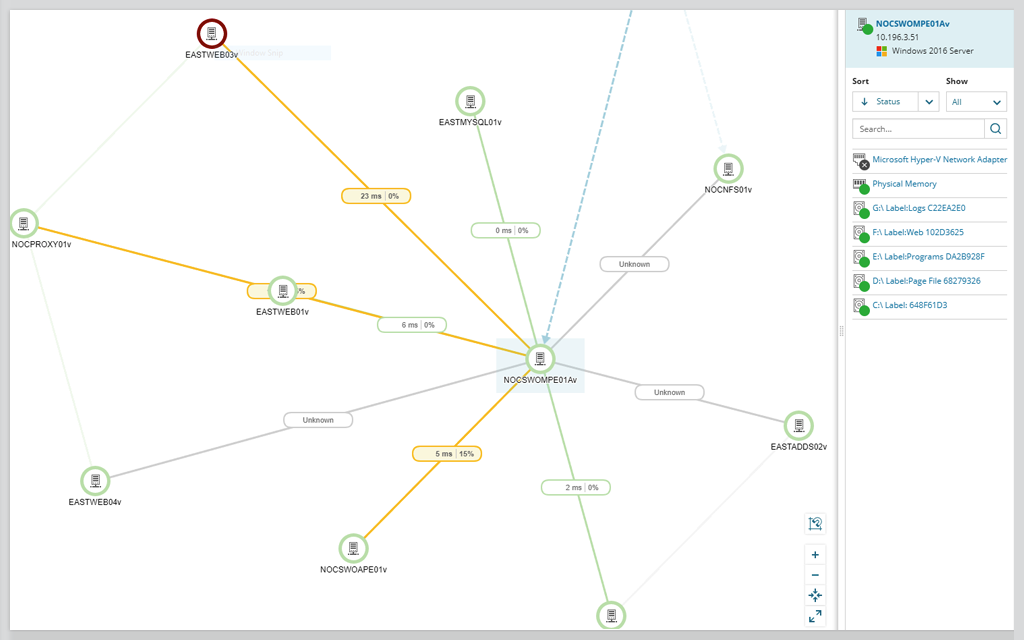
When users report an error, it’s easy to jump to finger-pointing. Eliminate blame and ensure users have the services they need by understanding the critical network paths with Network Performance Monitor. NPM network monitoring is designed to show all devices, applications, networks, and vendors in single-page path analysis for more signal and less noise to quickly isolate network slowdowns.
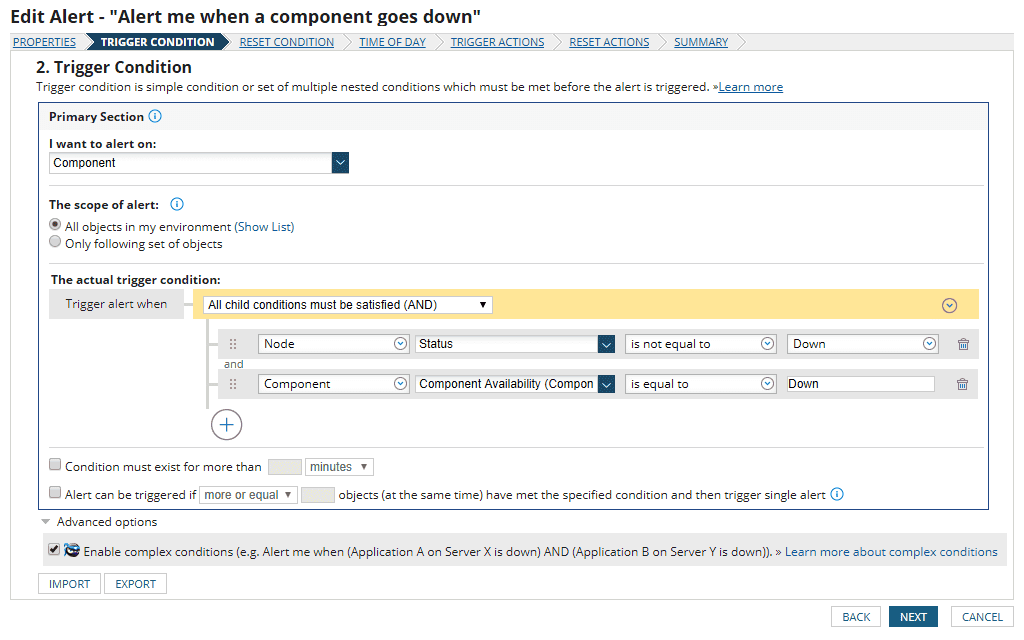
Alerts need to be informative and actionable. If you’re receiving so many that you can’t separate the signal from the noise, you might as well have no network monitoring alerts. With NPM network monitor, you can create alerts based on simple or complex nested trigger conditions, so your team can get meaningful information.
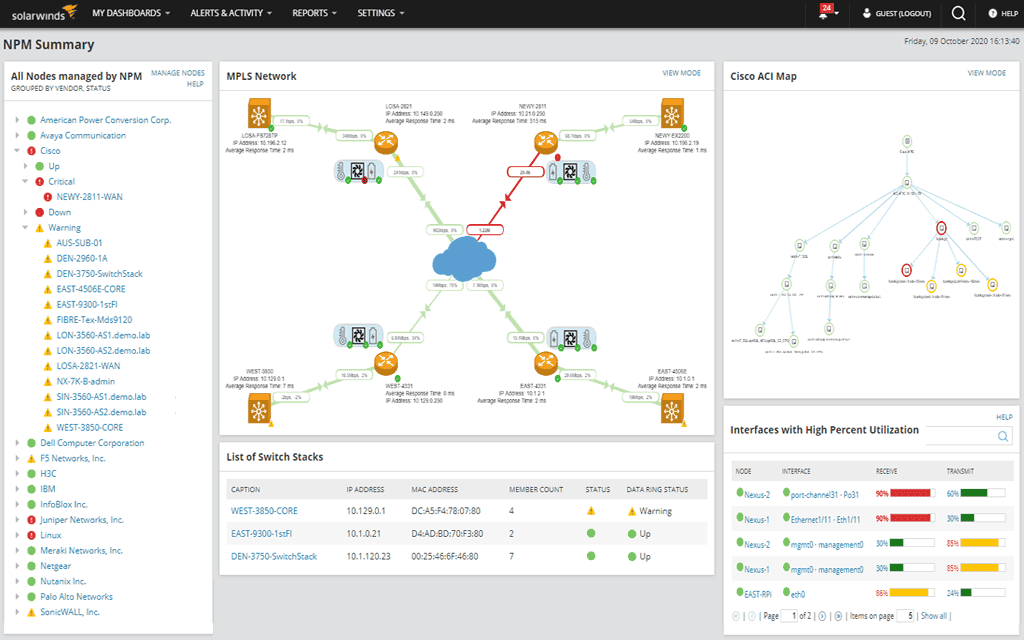
Visualization of data can be a powerful network monitor when put together in a meaningful way. The better you can visualize your environment, the easier it is to understand problems. Let auto-generating network visualization maps keep up with devices for you.
As applications and services shift from on-prem to the cloud, organizations need a tool to provide visibility into shifting workloads and application performance all in one tool. NPM provides support for Microsoft Azure with visibility into site-to-site connections, client VPNs, and ExpressRoutes for VPN status and performance metrics. For private cloud visibility, NPM also supports Cisco ACI monitoring and troubleshooting.
Failures in load balancing can present as intermittent outages and be frustrating to troubleshoot. Using network performance monitoring in NPM, you can quickly isolate what’s contributing to a slowness or service outage. Monitor the health and performance of all components of application delivery.
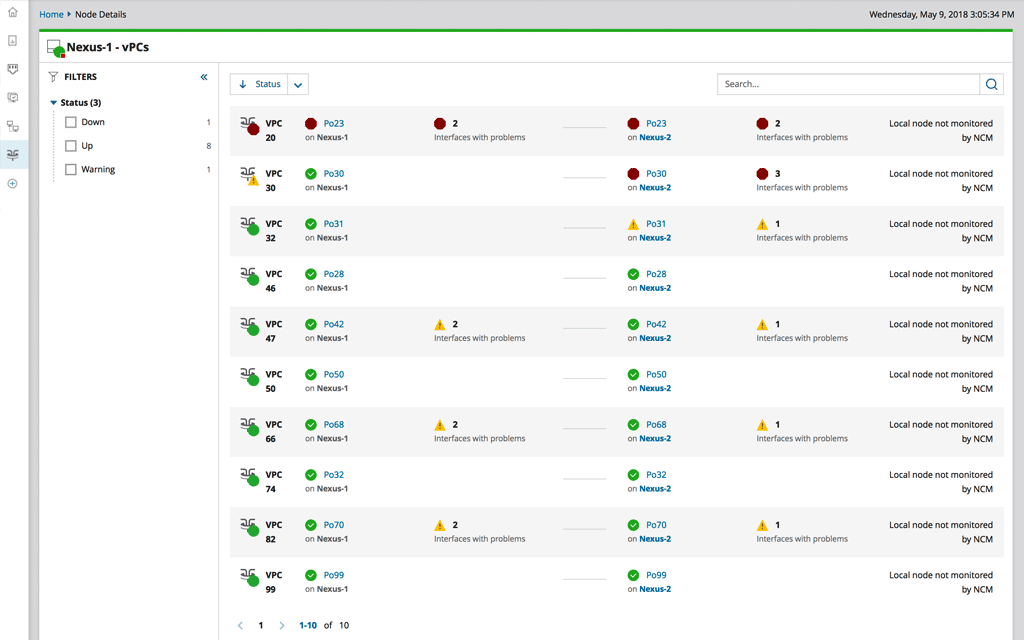
A problem on a vPC can mean you think you’re protected, but don’t have redundancy in place. The network performance monitoring tool in NPM is built to automatically map between vPCs, port channels, and physical ports across your Nexus switches to help ensure service availability.
SolarWinds
SolarWinds Hybrid Cloud Observability Advanced A25 (up to 25 nodes) – 106651HC – Annual Subscription


Reviews
There are no reviews yet.